 |
Ohio Automation, Inc. |
|
Mining Ventilation Software and More |
||
Engineering Software since 1985 |
||
| Home | AboutUs | MineSimU | MineVent | MineFire | MineWater | Downloads | ContactUs | Support | Services | Prices | Customers |
ICAMPS - Integrated Computer Aided Mine Planning Software |
||||
Call 740-596-1023 Today! |
||||
ICAMPS MineFire Mine Fire Ventilation System Simulation Software |
||||
Integrated Computer Aided Mine Planning Software (ICAMPS) MineFire is an AutoCAD application that offers a powerful graphical user interface to the former U.S. Bureau of Mines MFIRE version 2.20 which has been expanded upon and improved by NIOSH to include real-time modifications, now called MFIRE 4.0. ICAMPS MineFire (from here on referred to only as MineFire) is full 3D and you can use any of the AutoCAD commands you like to manipulate the drawing. However, if there is a MineFire menu option to complete the same task it is better to use that. For those who are familiar with ICAMPS MineVent the interface will look familiar and you will see many of the same powerful features. MineFire could also be useful even if you are not intending to model a fire. It has 3 phases which are the Steady State, Non-Steady State and the Quasi-Equilibrium. MineFire can, of course, be used to analyze internal influences such as a fire, but it can also be used to simulate ventilation networks under thermal and mechanical influence such as changes in ventilation parameters, external influences such as changes in temperature. The program output can be used to analyze the effects of these influences on the ventilation system. It includes discrete event simulation capabilities that allow mine ventilation and fires to be tracked over time.
|
||||
 |
||||
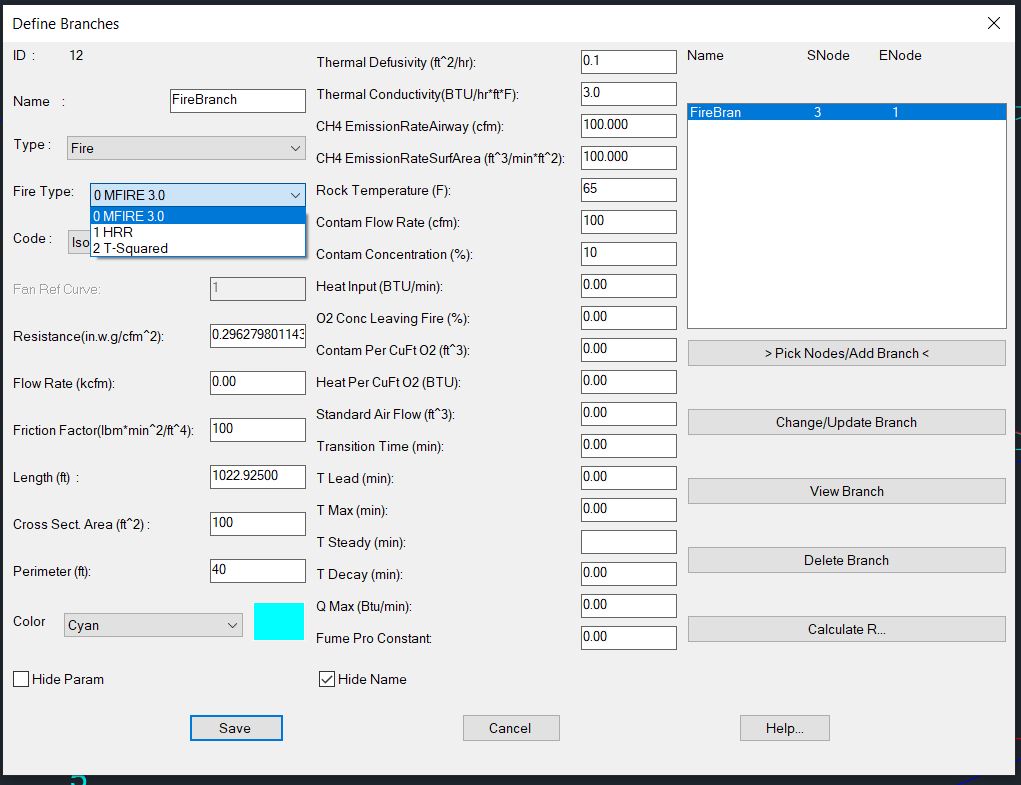
| Define Branches with 4 types Normal, Fan, FixedQ, Fire and 12 user defined codes. You only need to enter some or all the info on the right for Fire Branches. Fire branches can also be created in the Time Table at a specific time. | ||||
 |
||||
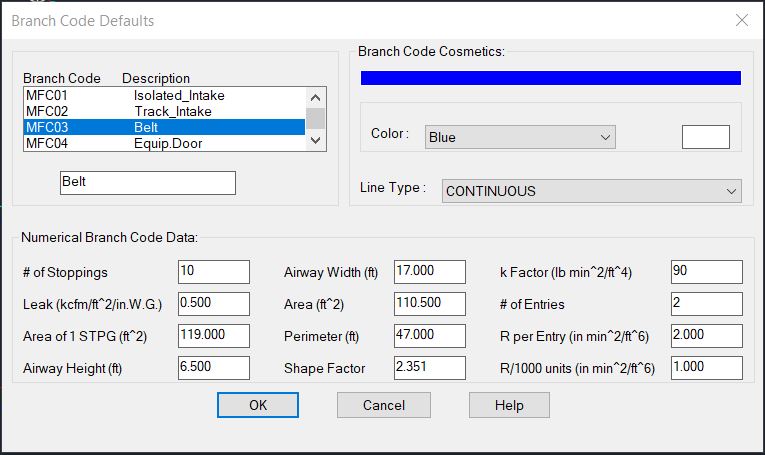
| Configure branches allows you to set up the colors and linetypes for the 12 different branch codes and the default resistance values for each code. | ||||
 |
||||
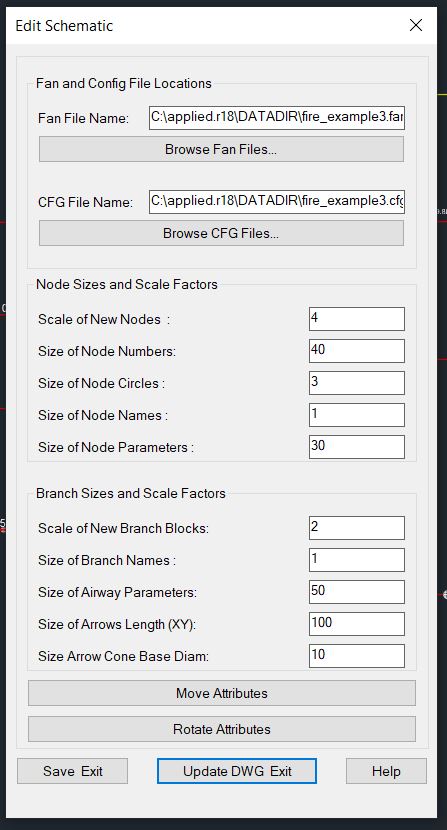
| Edit Schematic allows you to set the sizes of all the parameters as well as the default fan and cfg(configure branches) file and move and rotate parameters. | ||||
 |
||||
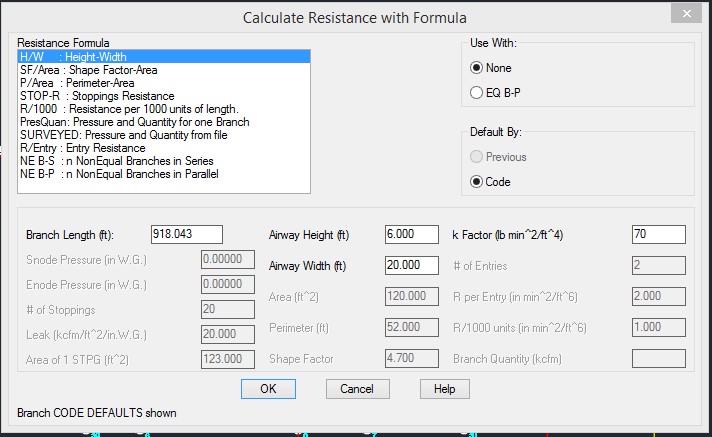
| Resistance Formula Dialog Box with 10 formulas branch length can be entered or calculated automatically. | ||||
 |
||||
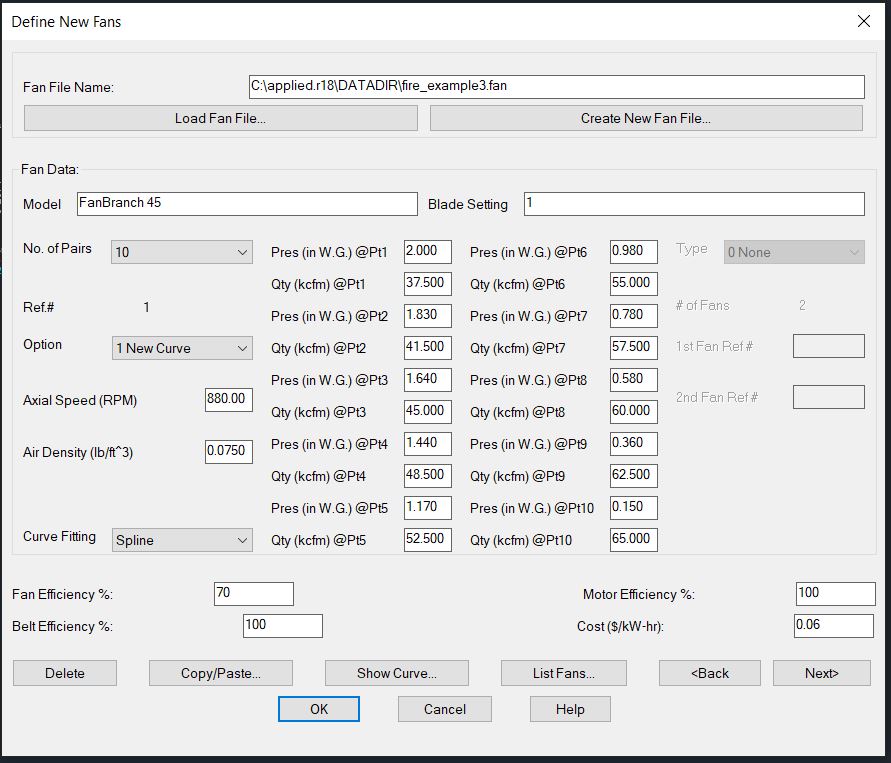
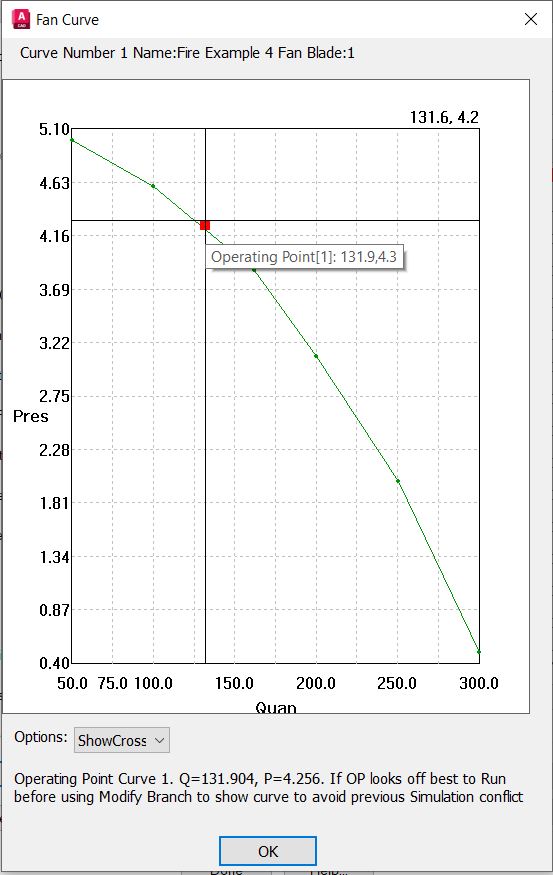
| Define Edit Fans allows you to enter the fan curve info up to 99 fan curves and show the curve or copy and paste P and Q data from spreadsheet. | ||||
 |
||||
 |
||||
 |
||||
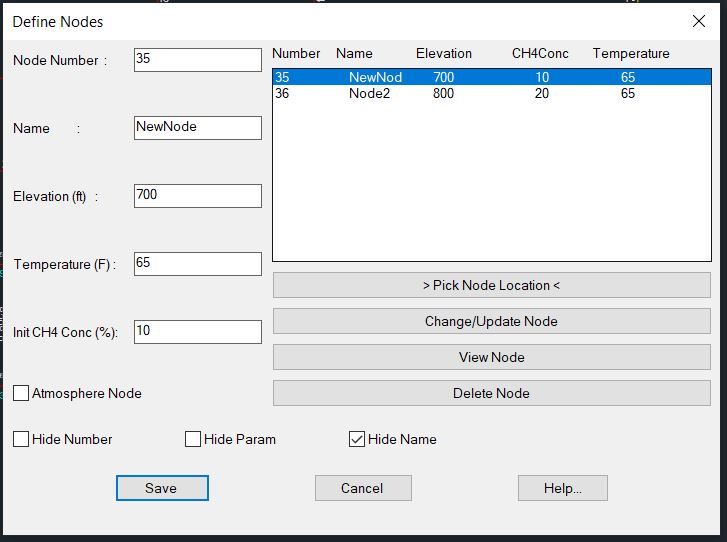
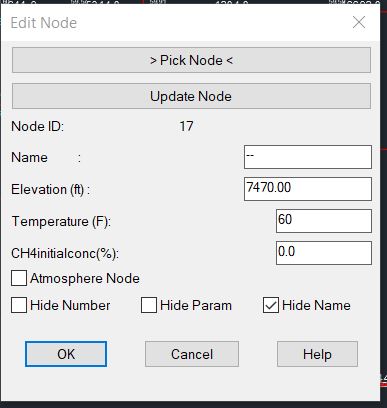
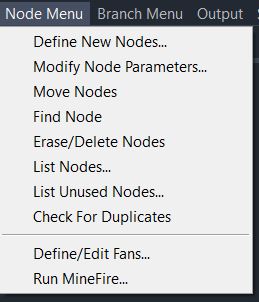
| Define new nodes and modify existing nodes easily. | ||||
 |
||||
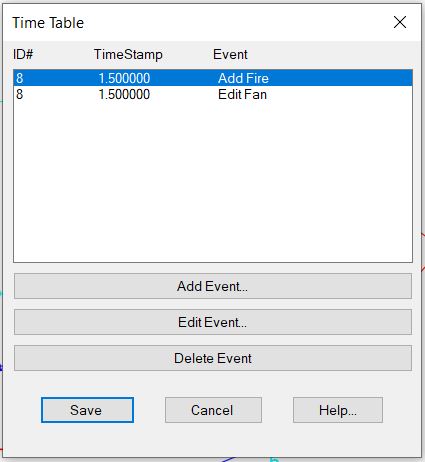
| MineFire has two ways to add a Fire or other ventilation change during the simulation. The first is to use the Time Table option and add an event at a certain time during the simulation and the second is to just do it in real-time as the program is running. You can also define a branch as a fire branch. | ||||
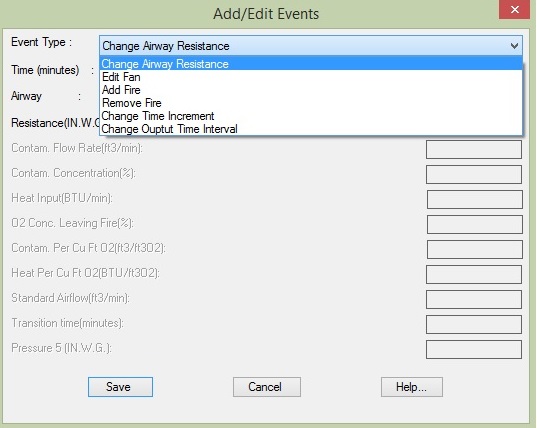
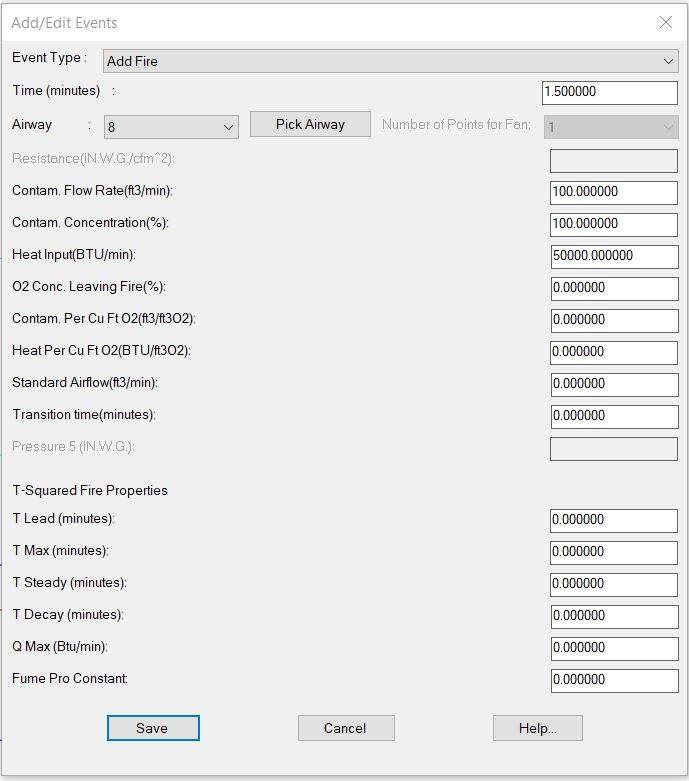
| The above would be used before the simulation starts to add/edit/delete events. Add and Edit bring up the following dialog. | ||||
 |
||||
 |
||||
| You can also get the above dialog and add an event in real-time while the simulation is running by clicking Add Event when the MineFire engine is running. See Run MineFire below. | ||||
 |
||||
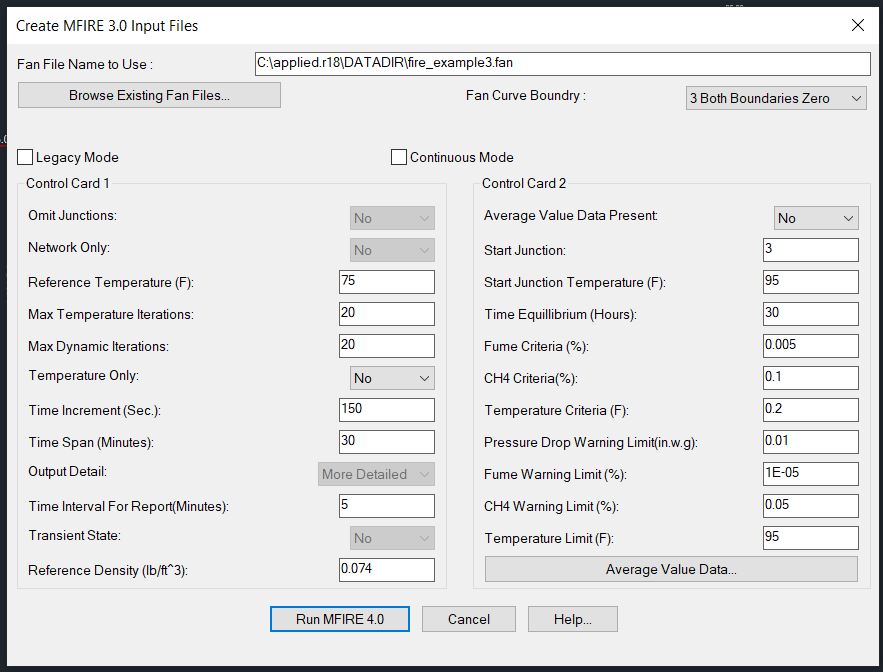
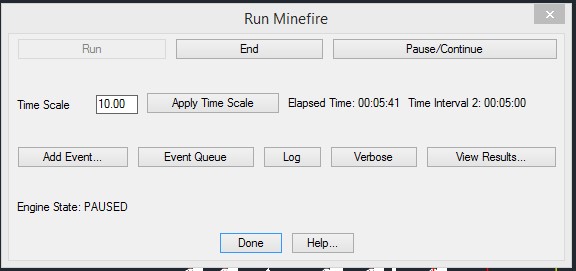
| Running the MineFire program allows you to setup all the values such as time increments and time span etc..then brings up the dialog below to run in real-time. | ||||
 |
||||
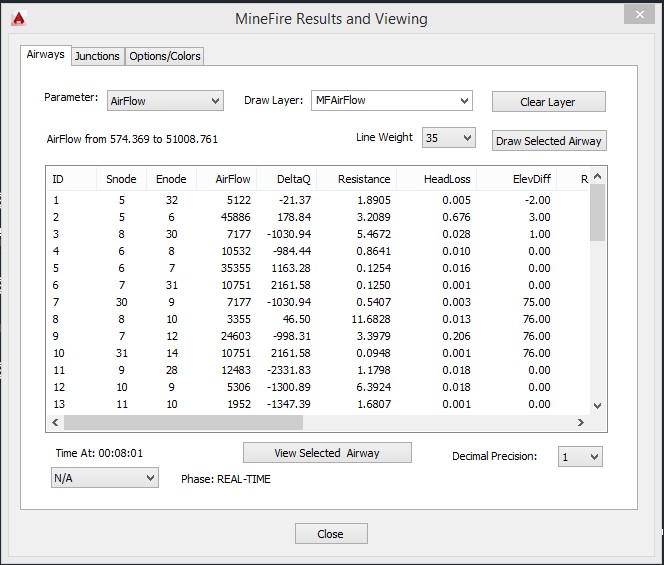
| In the dilalog above you can View Results graphically in real-time by clicking the View Results button which brings up the dialog below. The Verbose shows the text output file in real-time at that point in time. Of course, all of this and more is available under the Output Menu after the simulation finishes. Also in the above you can control how fast the simulation runs with the Time Scale and Pause or End at anytime. It will also show the Engine State at the bottom in case of any errors you can look at the Log file to see what happened. | ||||
 |
||||
| The above dialog box or some variation of it is used for most of the Output features. | ||||
 |
||||
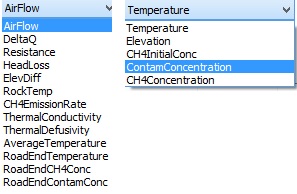
| The above shows the parameters that can be posted and colored in real-time on the Airways tab and the Junctions tab. The parameter names are always the same in real-time but the parameter names will change depending on which phase you are looking at under the Output Menu. | ||||
| Output consists of color coded schematics diagrams with many different parameters displayed individually for the airways/branches and junctions/nodes.The schematic can be plotted separately or superimposed on mine maps. The system has features that let the engineer highlight problem areas of the fire model based on the output. | ||||
 |
||||
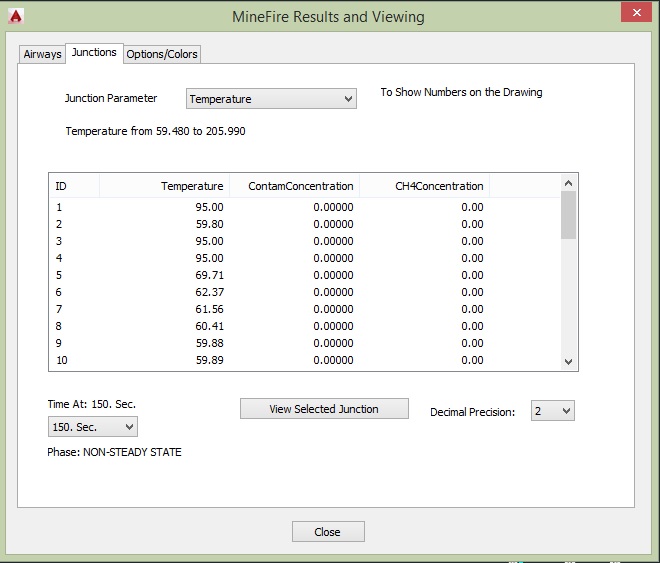
| The above shows the Junctions tab in the Non-Steady State portion. Note that you can change the time interval you want to post the numbers for at the bottom. The Airways tab has the same and affects not only the parameter but the color of the super-imposed polylines. | ||||
 |
||||
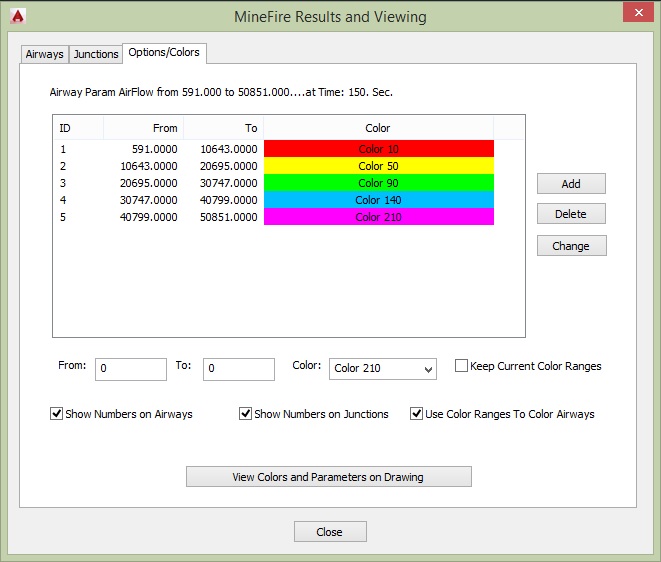
| The above shows how you can change the color ranges for ANY parameter on the Airways tab and also that you can check off the options of showing the Airway parameter, the Junction parameter, or the coloring of the Airways. | ||||
 |
||||
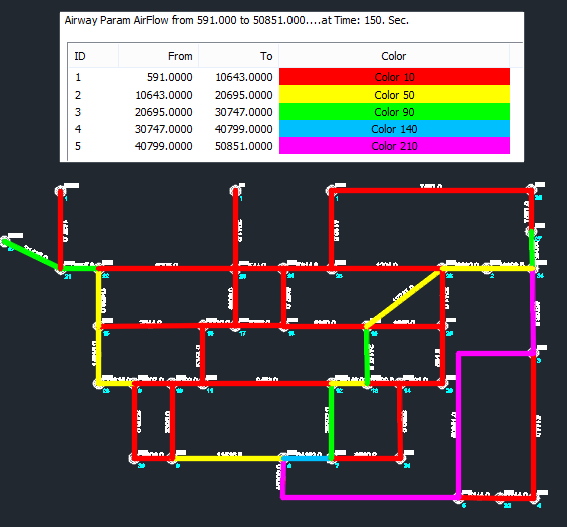
| The above is an example of posting the Airflow numbers on the branches/airways and the Fume numbers on the junctions/nodes with the drawing colored up by Airflow on the layer MFAirFlow. You can choose the layers for the super-imposed polylines. This is done simply by pressing View Colors and Parameters on drawing in the previous dialog. Also you can select the decimal precision from 0 to 7 decimal places for any parameter you post on the drawing. | ||||
 |
||||
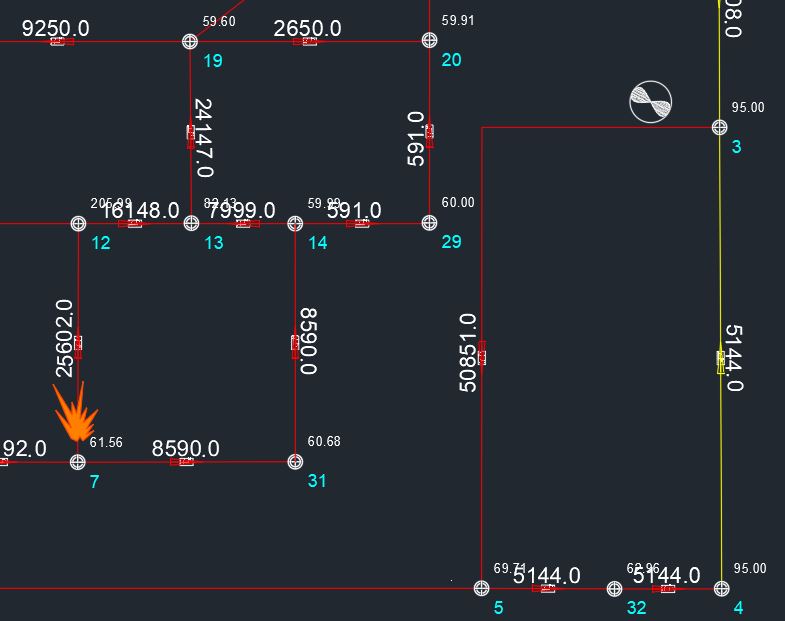
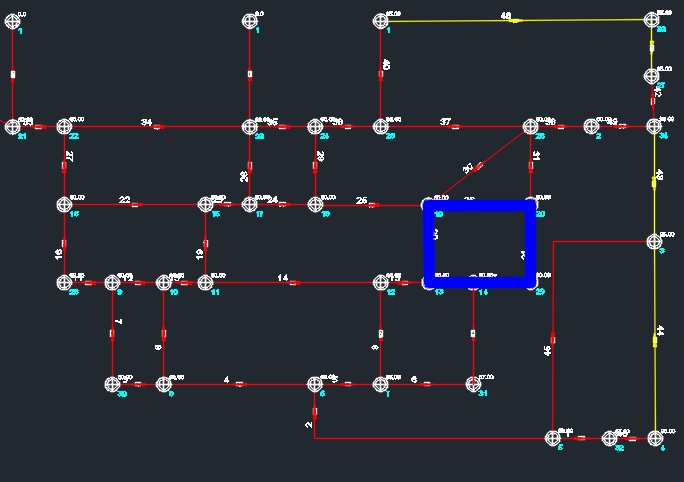
| The above shows how you can put Fire and Fan symbols on the appropraite airways. There are several other symbols that can be inserted as well. The temperatures are on the nodes and cfm on the airways. Many other parameters can be viewed as well. | ||||
 |
||||
 |
||||
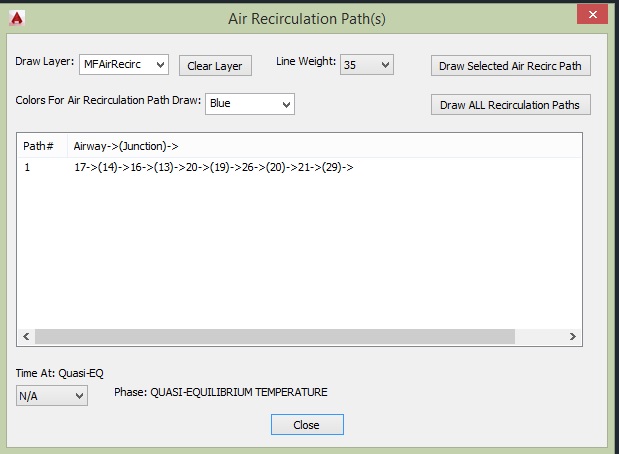
| The above two pictures show the interface for drawing Air Recirculation paths and the result on the drawing. | ||||
 |
||||
| The above shows how the program would color up and post the Critical Conditions for Airways and Junctions. The parameter posted and colored is Fumes. | ||||
 |
||||
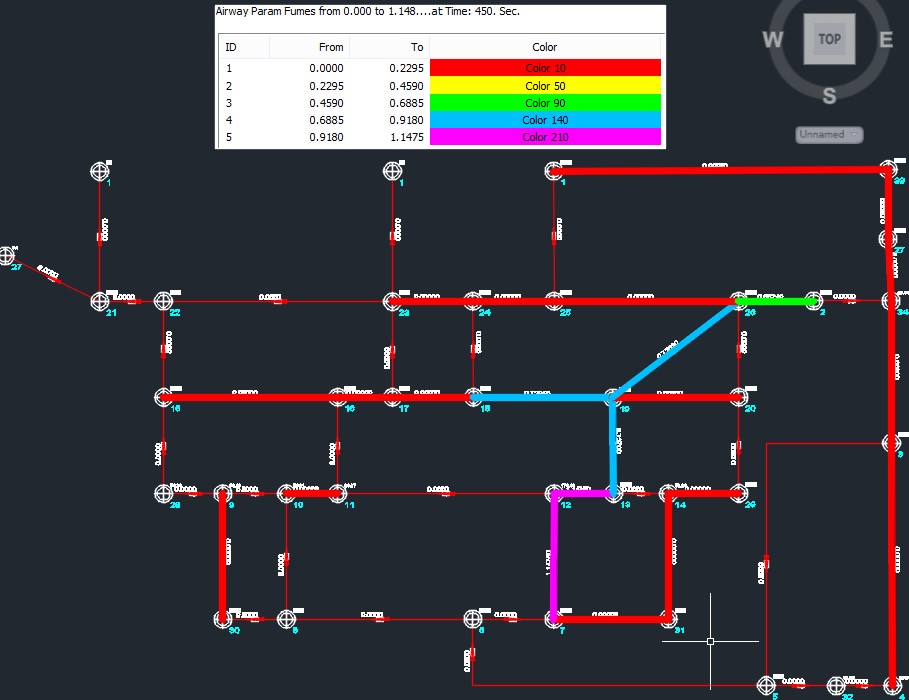
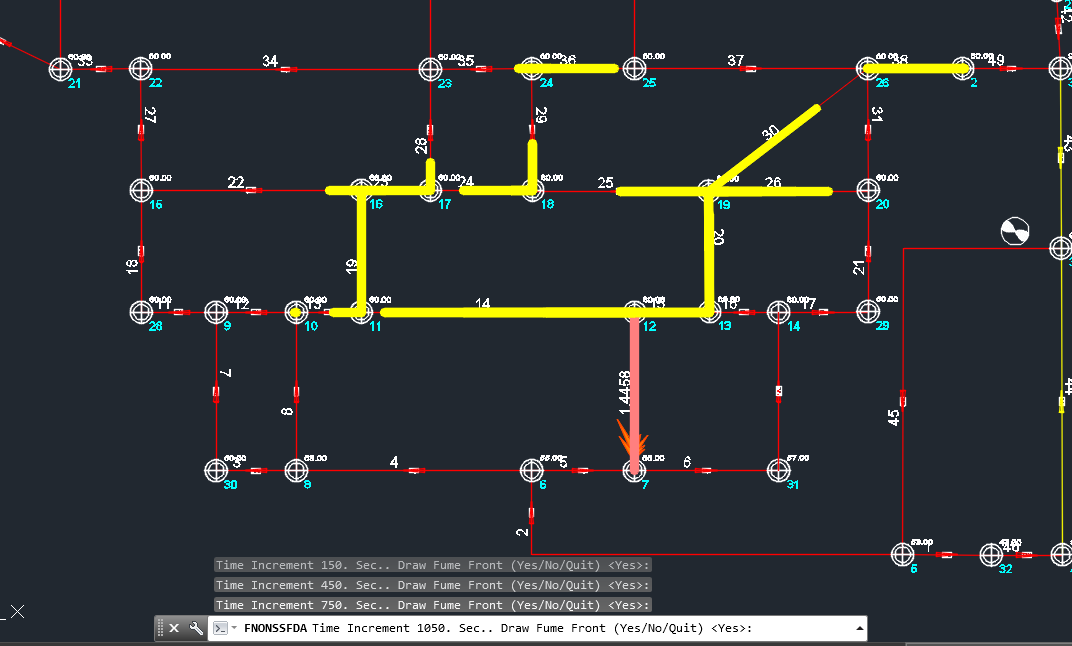
| The above shows the pregression of the Fume Front during the Non-Steady State portion of the program. The colors are by Fumes ranges but you could color by something else. | ||||
 |
||||
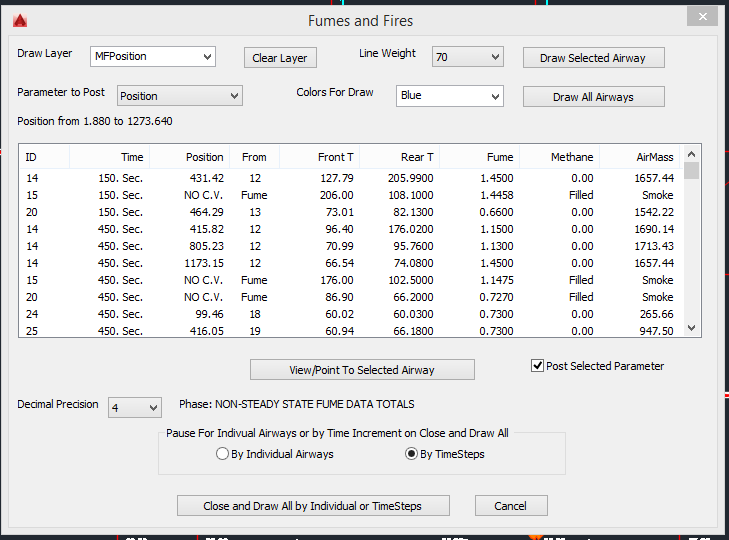
| The above Dialog allow you to see the Fume Front in an Animated fashion by pressing return on the AutoCAD command prompt. You can quit on any timestep or individual airway as you watch the fume or Fire progress or post parameters at any time interval. | ||||
 |
||||
| The above shows the results of watching the fume front progress in yellow with the fire branch as the more orange color. | ||||
 |
||||
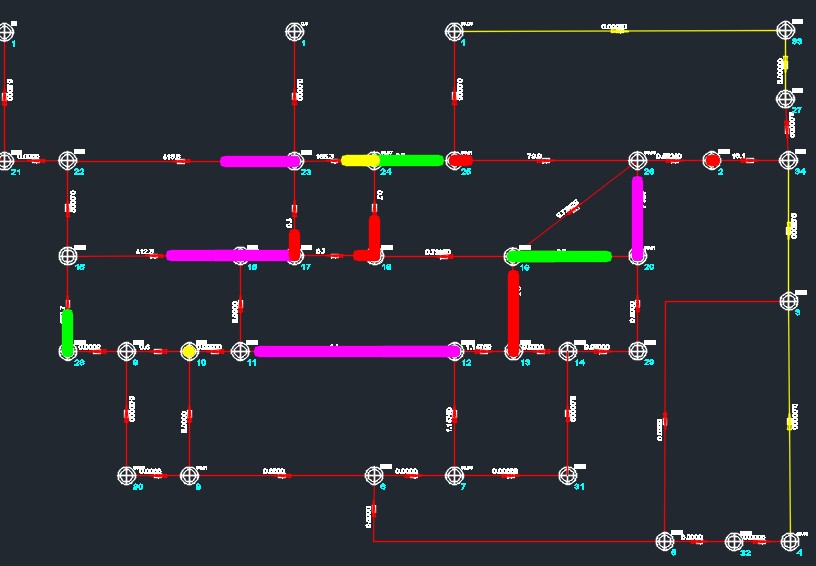
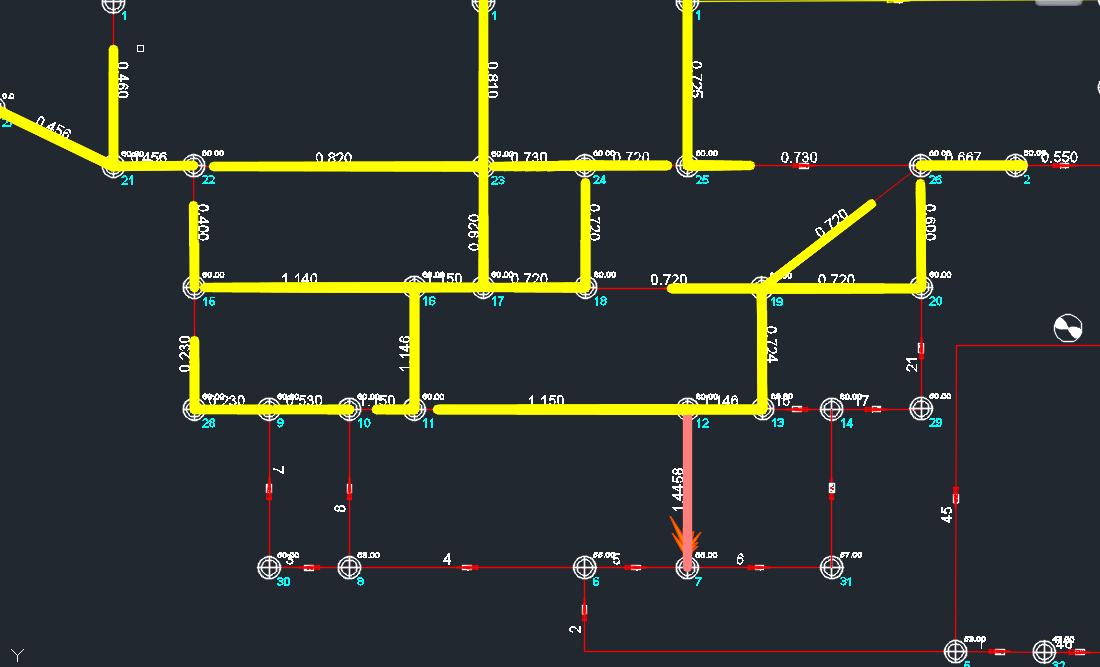
| The above shows the complete progression of the Fume Front with the Fume concentration posted on the airways. | ||||
 |
||||
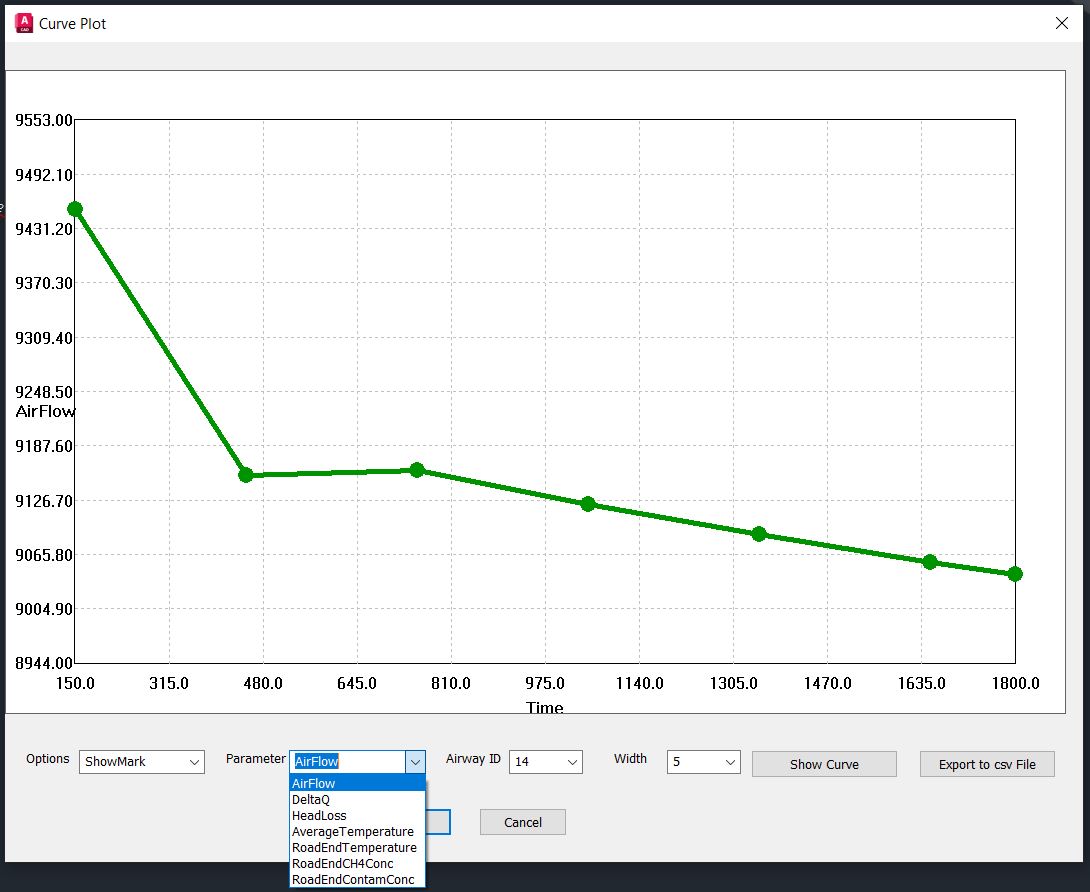
| The Non-Steady State curve plot allows you to show a curve of several parameters versus time. You can plot several parameters and choose the width as well as export the data to a csv file. | ||||
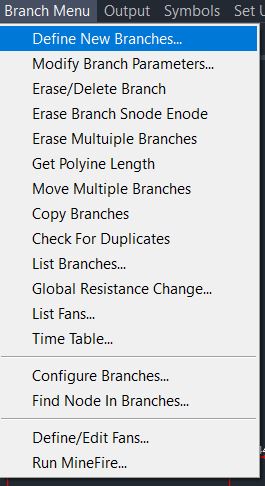
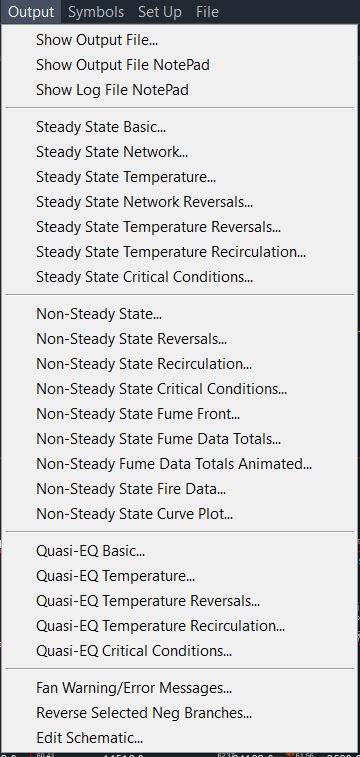
| Below are the main menu screen shots. There are other menus with helpful AutoCAD commands, symbols, setup and import and export features and more. | ||||
 |
||||
 |
||||
 |
||||
| Main MineFire Features | ||||
|
||||
| For more information on MineFire or to place an order please contact Ohio Automation at 740-596-1023 or email us ohioauto7@gmail.com | ||||
© 2000 - 2007 Ohio Automation All Rights Reserved |